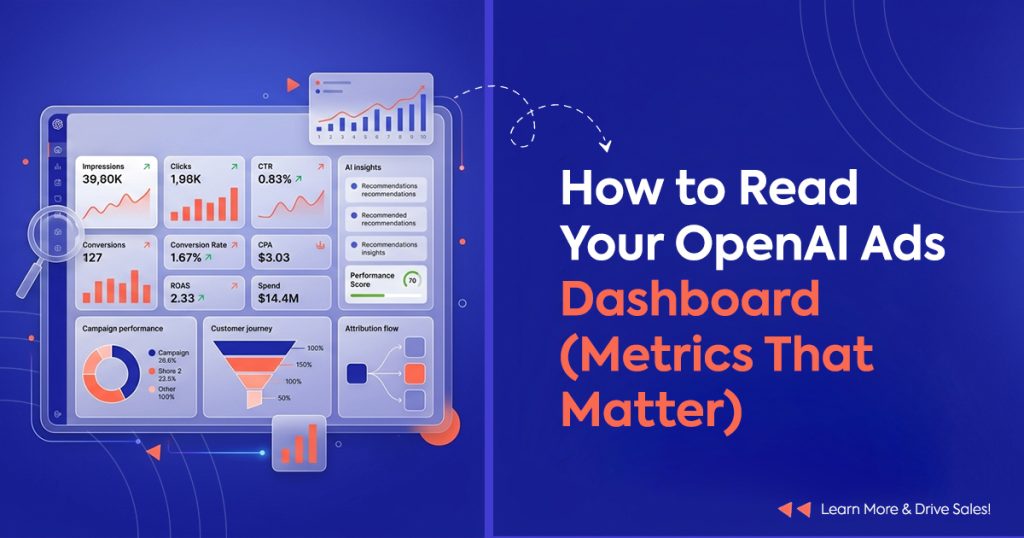
The OpenAI Ads dashboard shows you six numbers. Most advertisers treat all six as equally important, react to the wrong ones too early, and consequently make optimization decisions that hurt performance instead of improving it.
OpenAI ads metrics behave differently from what you’re used to on Meta or Google — because the auction is relevance-weighted rather than bid-weighted, the audience sits in research mode rather than buying mode, and the platform is months old rather than decades old. Reading the dashboard the way you read Meta’s Ads Manager will lead you to the wrong conclusions.
This guide explains every metric on the ChatGPT Ads dashboard, which ones deserve your attention at each stage, which ones mislead you if you act on them too early, and the one critical number your dashboard doesn’t show at all.
The Six Core Metrics on Your Dashboard
Before you decide what to optimize, you need to understand what each number actually measures in the context of conversational ads. Here’s what the OpenAI Ads Manager shows you.
Impressions
An impression counts each time your ad appears below a ChatGPT response. Unlike Meta, where impressions compete against dozens of other posts in a feed, a ChatGPT impression means your ad was the only sponsored result the user saw in that conversation. As a result, each impression carries more weight than a typical social impression.
Clicks
A click counts when the user taps your ad and lands on your destination URL. On ChatGPT, clicks represent a deliberate choice — the user already read an AI response, saw your ad, and decided your offer deserved a closer look. Consequently, each click signals stronger intent than a scroll-tap on Meta.
CTR (click-through rate)
CTR divides clicks by impressions. On ChatGPT Ads, the platform average sits around 0.68%, with top-quartile advertisers reaching roughly 1.0%. These numbers look low compared to Meta’s 0.9%–2.5% feed CTR, but the comparison misleads — ChatGPT ads appear below a response that often already answered the user’s question, so the structural incentive to click away is lower.
CPC (cost per click)
CPC tells you what you pay per click. ChatGPT Ads typically land in the $3–$5 range. However, CPC on this platform isn’t just a cost metric — it’s also a relevance signal. The relevance-weighted auction charges less for ads that match the conversation well. A declining CPC therefore means your creative improves, not just that competition dropped.
CPM (cost per mille)
CPM measures cost per thousand impressions. On ChatGPT Ads, CPM ranges from $25–$60 depending on category. This metric matters most for brand-awareness campaigns, but for ecommerce performance campaigns, CPC and CPA tell a more actionable story. CPM is useful context, not a decision driver.
Conversions
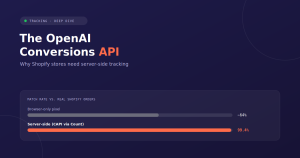
Conversions count the purchase events your pixel reports. This is the metric everything else feeds into — and also the metric most likely to lie to you. If your pixel misses sales (and browser-only pixels miss roughly 35%), your conversion count understates reality, which consequently makes every other metric look worse than it actually is.
Which OpenAI Ads Metrics to Act On
Not every metric deserves equal attention, and the ones that matter shift as your campaign matures. Here’s the priority order.
CPA — your north-star metric
Cost per acquisition tells you the real cost of each sale. It stabilizes faster than ROAS because it depends on conversion count rather than revenue precision. If your CPA trends downward week over week, the algorithm learns effectively. If it flatlines or rises despite consistent spend, something needs fixing — usually your creative or your tracking.
CTR — your relevance signal
On most platforms, CTR is a vanity metric. On OpenAI Ads, however, CTR directly affects your cost. The relevance-weighted auction rewards high-CTR ads with lower CPCs. Improving your CTR from 0.5% to 1.0% therefore compounds: you get more clicks and you also pay less for each one. Treat CTR as an input you optimize, not just an output you observe.
Conversion match rate — the metric your dashboard hides
Your dashboard shows conversion count, but it doesn’t show what percentage of your actual Shopify orders that count represents. If your pixel reports 20 conversions while Shopify recorded 31 orders, your match rate is 64% — and every other metric on the dashboard reflects that 64% picture rather than reality.
This is the single most important openai ads metrics check you can run, and the dashboard doesn’t do it for you. Compare platform conversions to Shopify orders for the same window every week. A ratio below 0.9 means your tracking needs fixing before any other optimization makes sense.
Which Metrics to Ignore Early
These metrics aren’t useless — they’re just unreliable until you’ve accumulated enough data. Acting on them prematurely does more harm than good.
Daily ROAS — too volatile before 30 conversions
ROAS divides revenue by ad spend. In small samples, a single high-value order makes one day look phenomenal while the next day looks like a failure. Wait until you’ve accumulated at least 30 purchase events before treating ROAS as a real signal. Before that threshold, CPA gives you a more stable read.
Impression volume — misleading in a thin auction
On Meta, low impressions usually mean your bid or budget is too low. On ChatGPT Ads, low impressions can also mean the algorithm hasn’t yet found enough relevant conversations for your product. The auction is thin, so impression volume fluctuates more than you’d expect. Don’t raise bids reflexively — instead, give the algorithm two weeks to find its context range.
Frequency — irrelevant in conversations
On Meta, high frequency signals ad fatigue. On ChatGPT, the concept barely applies. A user might ask related questions across multiple sessions, and seeing your ad more than once isn’t the same as being shown the same reel repeatedly. Frequency isn’t a lever to manage here.
How to Read the Dashboard Week by Week
Week 1: verify, don’t optimize
Look at one thing only: your event log. Confirm that page views, add-to-carts, and purchases flow to OpenAI in real time, with correct values, deduplicated. If the data foundation is solid, the noisy week-one metrics don’t matter yet. If the foundation is broken, every number you see is wrong and every decision you make compounds the error.
Week 2: watch CPA, swap the worst creative
CPA is the first metric stable enough to act on. If it trends within 2× of your target, the algorithm is learning. Swap your weakest ad variation for a new one and keep the top performers running. Also check your CTR — if one variation outperforms the others by 2× or more, that variation has found a conversational context the others miss.
Week 3: compare platform to Shopify
Run the conversion match audit. Pull your OpenAI Ads conversion count and your Shopify order count for the same seven-day window. If the ratio sits above 0.9, your tracking works and your metrics reflect reality. If it sits below 0.7, however, your pixel misses sales and every metric on the dashboard understates your actual performance. Fix tracking before optimizing anything else.
Week 4: evaluate and decide
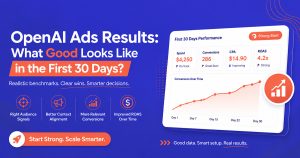
By now you have enough data to trust your CPA, your CTR, and your directional ROAS. Compare them against the benchmarks: CPA within 1.5× of target, CTR above 0.6%, ROAS between 2× and 5×. If you hit those ranges, scale budget by 20–30%. If you fall short, audit creative and tracking before concluding the channel doesn’t work.
The Number Your Dashboard Can’t Show You
Revenue attribution — which specific campaign, ad set, and creative variation drove which revenue — is the layer that separates dashboard reading from actual decision-making. Your OpenAI Ads dashboard shows aggregate conversions. It doesn’t break down which of your five ad variations generated the $8,000 in revenue last week and which one generated $200.
That attribution gap is exactly what Count’s revenue attribution view fills. The Starter plan ($9/month) matches each conversion to its source campaign and creative, so you know where your money actually comes from rather than guessing from aggregate numbers. Combined with the server-side pixel’s 99.4% match rate, it turns a dashboard that shows you what happened into one that tells you why.
The free plan covers the full server-side pixel, deduplication, and real-time event log. Revenue attribution starts at Starter. If you’re reading your dashboard daily and making campaign decisions, the attribution layer is where the upgrade pays for itself.
Install Count on Shopify — free →
Frequently Asked Questions
Understanding the metrics
Q1: What openai ads metrics should I check first?
Start with your conversion match rate — compare your ad platform’s conversion count to your Shopify order count for the same week. If the ratio sits below 0.9, your tracking misses sales and every other metric on the dashboard understates reality. Once you verify tracking accuracy, shift your focus to CPA as your primary performance metric.
Q2: Why does my ChatGPT Ads CTR look so low compared to Meta?
ChatGPT Ads average roughly 0.68% CTR, while Meta feed ads average 0.9%–2.5%. The difference reflects placement mechanics rather than performance quality. A ChatGPT ad appears below an AI response that often already answered the user’s question, so the structural incentive to click away is lower. A 0.68% CTR on ChatGPT therefore represents stronger intent per click than a 2% CTR on Meta.
Q3: What’s a good CPC for OpenAI Ads?
CPCs typically land between $3 and $5, with bids below $3 rarely clearing delivery thresholds. However, CPC on this platform also functions as a relevance signal — the auction charges less for ads that fit the conversation well. A declining CPC over time therefore means your creative improves, not just that the auction gets cheaper.
Q4: When should I start looking at ROAS?
Wait until you’ve accumulated at least 30 conversion events, which typically takes two to three weeks at $25–$50/day. Before that threshold, daily ROAS swings wildly based on individual high-value or low-value orders. CPA gives you a more stable read during the early period.
Dashboard gaps and tracking
Q5: Why does my dashboard show fewer conversions than Shopify?
Because a browser-only pixel misses roughly 35% of actual sales to ad blockers, iOS privacy restrictions, and checkout redirects. The dashboard only displays what the pixel reports, not what actually happened. Server-side tracking closes this gap by confirming every order directly from Shopify’s servers.
Q6: What is revenue attribution and why doesn’t the dashboard include it?
Revenue attribution breaks down which specific campaign and creative variation drove which revenue. The OpenAI Ads dashboard shows aggregate conversions but doesn’t split them by source at the granularity most advertisers need. A tracking app like Count fills this gap — the Starter plan matches each conversion to its source campaign so you can identify winners and cut losers with precision.
Q7: How often should I check the OpenAI Ads dashboard?
During the first two weeks, check the event log daily to verify data flows correctly. After that, shift to a weekly cadence: every Monday, compare platform conversions to Shopify orders, review CPA and CTR trends, and swap the weakest creative variation. Daily dashboard-checking after the first two weeks encourages overreaction to normal variance.